Student Grade Analysis
📋 Context
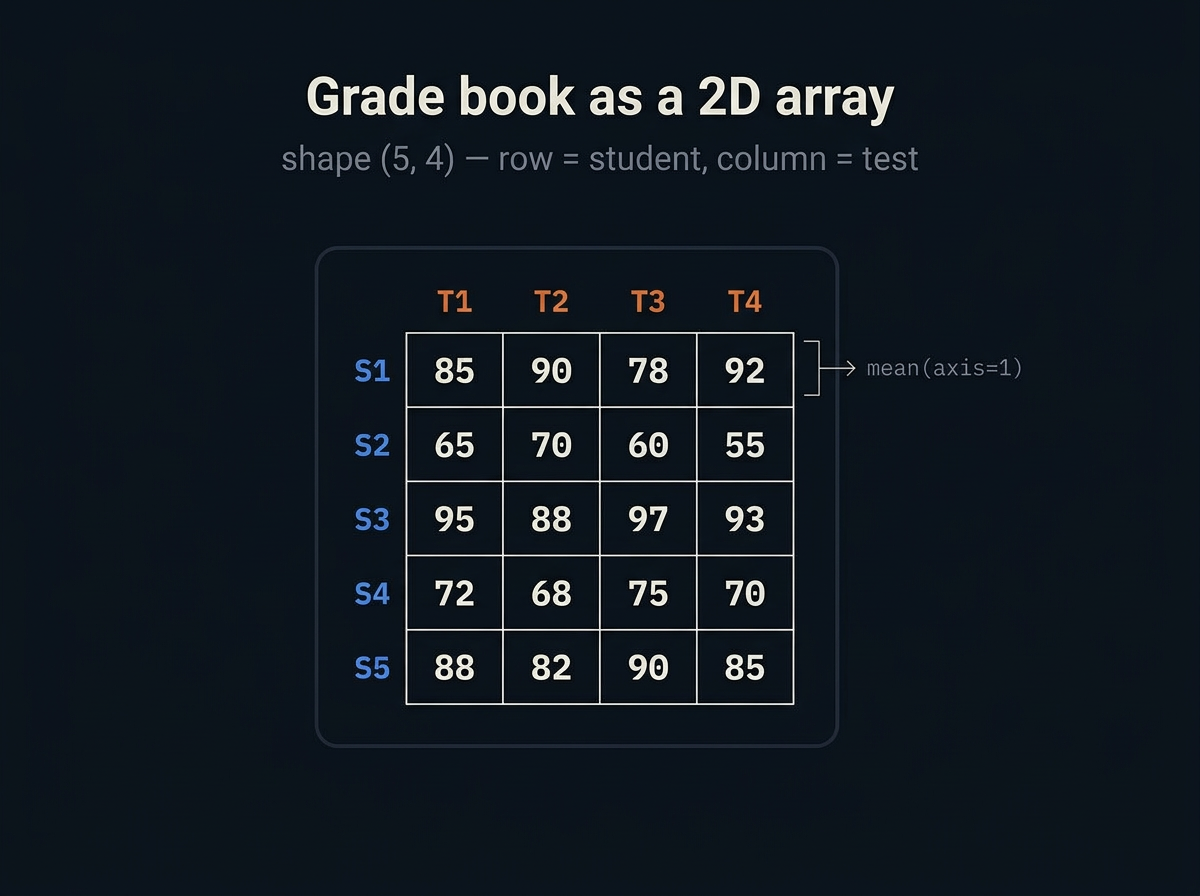
You're a teacher with exam scores for 5 students across 4 tests. You need to analyze performance, identify struggling students, and reason about the grade book as a single numerical object.
This scenario uses the same patterns as the Aggregation and Boolean indexing lessons.
1
2
3
Step 1: Load & Inspect
🎯 Task
Create a 2D array grades with this data (5 students × 4 tests):[[85,90,78,92],[65,70,60,55],[95,88,97,93],[72,68,75,70],[88,82,90,85]]
Print its shape.
np.array([[85,90,78,92],[65,70,60,55],...])
⌘⏎ run · ⌘← → nav
▶ Output
Run your code to see output here.